
How to Read Matka Charts Like a Pro
Abdul Rahaman is a Full Stack Developer & Marketing Expert specializing in scalable web platforms, digital acquisition, and data analytics.
How to Read Matka Charts Like a Pro
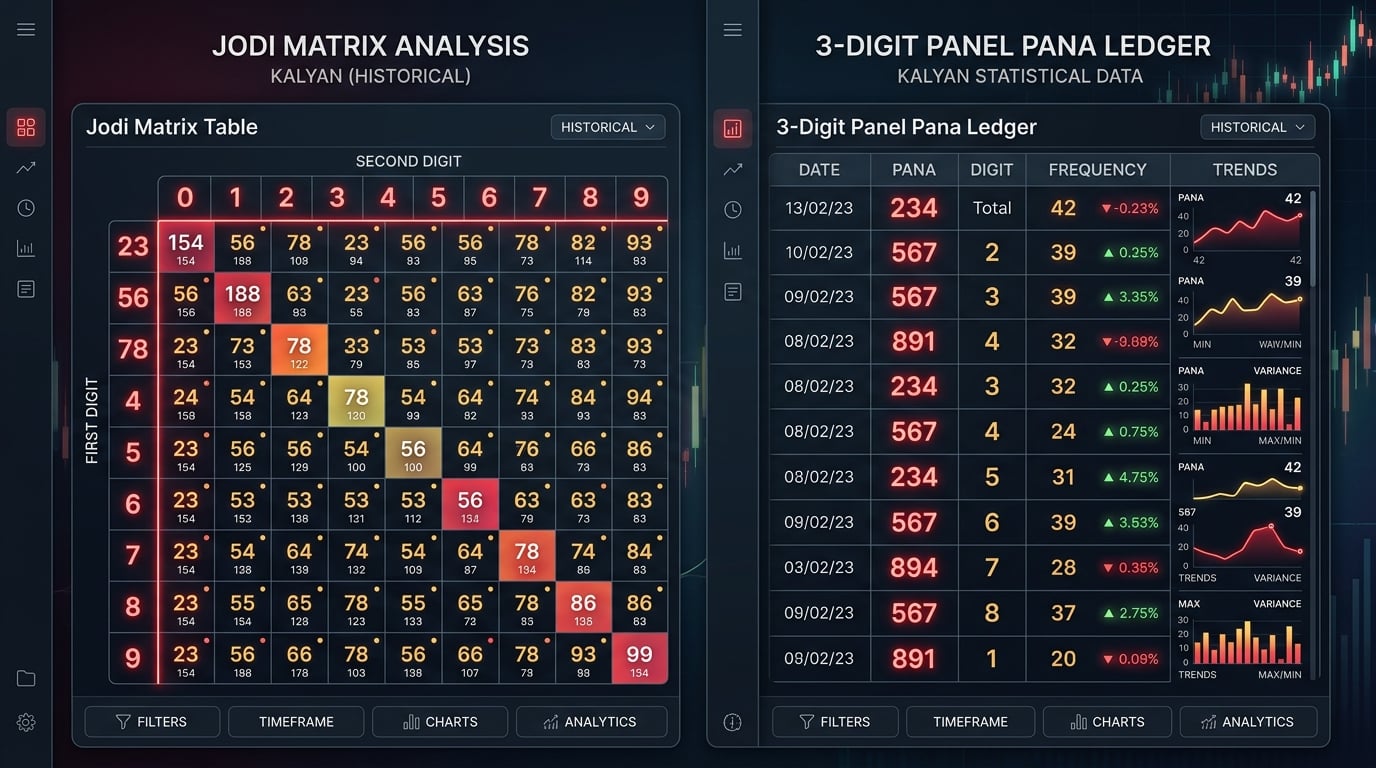
Executive Summary (TL;DR)
- What is a Matka Chart? A structured calendar grid that records historical draw outcomes, categorized primarily into Jodi (2-digit pairs) and Panel/Pana (3-digit combinations + Jodi).
- Key Chart Types: Jodi Charts map weekly progressions (00-99), while Panel Charts reveal the entire draw mechanism ([Open Pana] - [Jodi] - [Close Pana]).
- Crucial Concept — Cut Numbers: Understanding the concept of "Cut Numbers" (digits paired by a difference of 5) explains why certain Jodis are flagged as "Red Brackets."
- Analytical Mindset: Charts are historical ledgers for statistical observation; every draw remains governed by independent probability.
For anyone exploring Satta Matka beyond casual observation, the ability to read and interpret market charts is the single most important skill. To an untrained newcomer, a chart appears as a chaotic sea of numbers, red-highlighted brackets, and three-tiered numerical stacks.
However, to experienced statistical analysts, a Matka chart is an orderly historical ledger. It reflects chronological records across decades of daily market declarations.
Building upon our foundational Complete Beginner's Guide to Satta Matka, this advanced tutorial teaches you how to read Matka charts like a pro. We will break down chart grids, decode Panel and Jodi structures, explain the mathematics of "Cut Numbers" and "Red Jodis," and demonstrate how to utilize ShreeMatka data archives effectively.
The Anatomy of a Matka Chart: Understanding Grid Layouts
Every official Matka chart is formatted as a standardized calendar matrix. Whether you are inspecting the Kalyan Jodi Chart or reviewing Milan Night archives, the structural principles remain consistent.
| Week | Mon | Tue | Wed | Thu | Fri | Sat | Sun |
|---|---|---|---|---|---|---|---|
| Week 01 | 258-54 | 134-89 | 456-50 | 127-03 | 678-12 | 239-47 | ** |
| Week 02 | 348-52 | 249-56 | 147-28 | 560-19 | 378-83 | 112-44 | ** |
1. Columns (Days of the Operating Week)
The horizontal header row denotes the operational days of the market:
- Most primary markets operate from Monday to Friday or Monday to Saturday (such as Kalyan Matka).
- Newer markets may operate all 7 days, including Sunday.
- Days on which a market is closed for public holidays or weekly rest display symbols like
**or--.
2. Rows (Calendar Weeks)
Each row represents one full calendar week (Monday through weekend). Moving vertically down the chart allows you to trace weeks, months, and quarters chronologically.
3. Individual Cells (Daily Results)
Each cell represents a single operating day. Depending on the chart format you are viewing, that cell contains either a Jodi (2 digits) or a Complete Panel Stack (three lines of numbers).
To see how rules and betting rates interact with these grids, consult our How to Play Guide.
Jodi Charts Explained: Decoding the 2-Digit Matrix
A Jodi Chart is the simplest and most widely referenced visual tool. It focuses strictly on the combined two-digit outcome (00 through 99) generated each day.
How a Jodi Cell is Read
- If Monday displays
54, it means:- The Open Ank (first draw single digit) was
5. - The Close Ank (second draw single digit) was
4.
- The Open Ank (first draw single digit) was
- If Tuesday displays
89, the Open Ank was8and the Close Ank was9.
Understanding "Red Jodi" (Red Brackets)
As you scroll through any Jodi chart on ShreeMatka, you will observe certain cells highlighted in bright red. In the Matka lexicon, these are called Red Brackets or Red Jodis.
A Jodi is designated as "Red" under two specific mathematical conditions:
Condition 1: Double Numbers (Twins)
When both the Open Ank and Close Ank are identical:
💡 Formula / Calculation:
{00, 11, 22, 33, 44, 55, 66, 77, 88, 99}
Condition 2: Cut Pairs (Half-Family Pairs)
When the two digits differ by exactly 5 in the decimal sequence (known as Cut Numbers):
💡 Formula / Calculation:
{05, 50, 16, 61, 27, 72, 38, 83, 49, 94}
Because these pairs represent symmetrical or inverted mathematical groupings, historical ledgers have highlighted them in red for over sixty years to make statistical identification effortless.
The Mathematics of "Cut Numbers" and Family Groups
To read charts at a professional level, one must understand the concept of Cut Numbers (Ank Ka Cut). In Indian numerical systems, each digit from 0 to 4 is paired with a corresponding counterpart in the 5 to 9 range:
| Original Digit | Cut Digit (Digit + 5) | Pair Relationship |
|---|---|---|
| 0 | 5 | 0 ↔ 5 |
| 1 | 6 | 1 ↔ 6 |
| 2 | 7 | 2 ↔ 7 |
| 3 | 8 | 3 ↔ 8 |
| 4 | 9 | 4 ↔ 9 |
Why Cut Numbers Matter in Chart Analysis
When analysts study a Jodi like 24, they often examine its "Family Group" (Parivar), which includes all variations formed by replacing each digit with its Cut counterpart:
- Original Jodi:
24 - Inverted Jodi:
42 - Half-Cut Variations:
29(replacing 4 with 9) and74(replacing 2 with 7) - Full-Cut Variations:
79(replacing both 2 and 4 with 7 and 9) and97
Recognizing these mathematical relationships helps observers understand why historical chart records often display clusters of related families over consecutive cycles.
Panel (Pana) Charts Explained: The 3-Digit Ledger
While Jodi charts provide an executive view, a Panel (Pana) Chart delivers granular operational data. It tracks the exact three-digit draws that determined the single digits.
In a Panel chart, each daily cell contains a 3-tier vertical stack:
| Cell Position | Element | Sample Value |
|---|---|---|
| Top Row | Open Pana | 258 |
| Center Row | Jodi Result | 54 |
| Bottom Row | Close Pana | 347 |
- Top Row (Open Pana): The three digits drawn during the opening session (2, 5, 8), sorted in ascending order.
- Middle Row (Jodi): The combined two-digit result (54).
- Bottom Row (Close Pana): The three digits drawn during the closing session (3, 4, 7), sorted in ascending order.
Categorizing the Three Types of Panas
When reading Panel charts on our Kalyan Pana Chart page, you will notice three structural variations of the 3-digit panels:
| Pana Category | Defining Characteristics | Possible Combinations | Example |
|---|---|---|---|
| Single Pana (SP) | All three digits are distinctly unique. | 120 unique sets | 138, 258, 347 |
| Double Pana (DP) | Two digits are identical; one digit is different. | 90 unique sets | 112, 335, 448 |
| Triple Pana (TP) | All three digits are identical (Patti Jackpots). | 10 unique sets | 111, 555, 777 |
Understanding these categories allows chart analysts to immediately distinguish high-frequency draws from rarer double or triple panels. Explore the complete library on our Live Matka Charts directory.
Step-by-Step Tutorial: Analyzing a Real Chart Record
Let us walk through an actual scenario using a real historical record from the Kalyan Matka archive:
Sample Cell Data:
149 - 48 - 378
Follow these 4 analytical steps to decode this entry:
Step 1: Verify the Open Draw Mechanics
- Three-digit Open Pana:
149 - Sum calculation: 1 + 4 + 9 = 14
- Last digit:
4 - Result: Open Ank is confirmed as
4.
Step 2: Verify the Close Draw Mechanics
- Three-digit Close Pana:
378 - Sum calculation: 3 + 7 + 8 = 18
- Last digit:
8 - Result: Close Ank is confirmed as
8.
Step 3: Check the Jodi Validity
- Combining Open Ank (4) + Close Ank (8) gives Jodi
48. - Notice: Is 48 a Red Jodi?
- Digits are 4 and 8. They are not identical (4 ≠ 8).
- Difference: 8 - 4 = 4 (not 5).
- Therefore, 48 is a standard black Jodi, not a Red Bracket.
Step 4: Check Panel Formats
- Open Pana
149has three distinct digits → Single Pana. - Close Pana
378has three distinct digits → Single Pana.
By performing this verification routinely, you develop an intuitive command of market structures and can spot anomalies or typos on unofficial websites effortlessly.
Common Chart Reading Mistakes Beginners Make
Even enthusiastic learners often fall victim to cognitive traps when analyzing historical charts:
1. Confusing Correlation with Causation
Just because an Open Pana like 258 was followed by a Close Pana of 347 on two occasions three months apart does not mean 258 causes 347. The two draws occur hours apart through completely independent mechanisms.
2. The "Overdue Number" Fallacy
Looking at a chart and observing that the digit 0 has not appeared in the Open position for twelve days can lead players to conclude that 0 is "guaranteed" tomorrow. Mathematically, every single draw has a flat 10% probability for each digit (0-9). The past has no memory.
3. Relying on Low-Quality, Outdated Websites
Many third-party blogs publish unverified charts with missing dates, incorrect sums, or delayed declarations. Always rely on synchronized, high-performance data platforms like ShreeMatka where historical ledgers are audited against authentic market declarations.
Frequently Asked Questions
What is the difference between a Jodi Chart and a Pana Chart?
A Jodi Chart records solely the two-digit final outcome (00-99) for each day of the week, offering a quick overview of daily pairs. A Pana (Panel) Chart records the full 3-digit opening panel, the 2-digit Jodi, and the 3-digit closing panel, providing complete insight into the underlying draw numbers.
Why are some numbers colored red in Matka charts?
Numbers colored red in Matka charts are known as Red Brackets or Red Jodis. A Jodi is highlighted in red when both digits are identical (such as 11, 22, 55) or when the two digits form a "Cut Pair" differing by 5 (such as 05, 16, 27, 38, 49).
What are Cut Numbers in Satta Matka chart analysis?
Cut Numbers are pairs of digits related by adding or subtracting 5 within the 0-9 decimal system (0 ↔ 5, 1 ↔ 6, 2 ↔ 7, 3 ↔ 8, 4 ↔ 9). Analysts use Cut Numbers to categorize related Jodi families and understand historical distribution patterns across market charts.
How are the three digits in a Pana arranged on a chart?
In official Matka chart records, the three digits comprising any Pana (panel) are always arranged in strictly ascending order (from smallest to largest). For example, if numbers 8, 2, 5 are drawn, the resulting Pana is formatted and cataloged as 258.
Where can I find verified daily Kalyan and Milan Matka charts?
Verified, live-synchronized Matka charts are available directly on the ShreeMatka Charts Directory, with dedicated historical archives for Kalyan Jodi, Kalyan Pana, Milan Day, Milan Night, Rajdhani, and Time Bazar.
Disclaimer
Visiting and browsing this website is strictly at your own risk. All information available here is for informational and entertainment purposes only and is based on number calculations. We are not associated or affiliated with any illegal Matka business. We make every effort to follow the rules and regulations of the regions from which the website is accessed. There is a chance the website may be banned in your area; if you continue to use it after that, you alone are responsible for any damage, loss or legal action that may follow. Satta Matka may be illegal in your jurisdiction — please be aware of and comply with your local laws. Gambling can be addictive; players must be 18 or older, and underage gambling is strictly prohibited. If you do not agree with this disclaimer, please leave the website immediately. Copying any content posted on this website is strictly prohibited.